What is on the page
- Task number
- A number for each row, such as 1 for a phase and 1.1, 1.2 for the tasks under it. Dependencies can then point to a task by number.
- Task, phase or milestone
- Phases in capitals with their tasks underneath, each on one line.
- Owner
- One name per task.
- Start and end dates
- The first and last day of the task. In Excel, type them as dates (2/1/2027) so the duration and the bars can be worked out.
- Duration
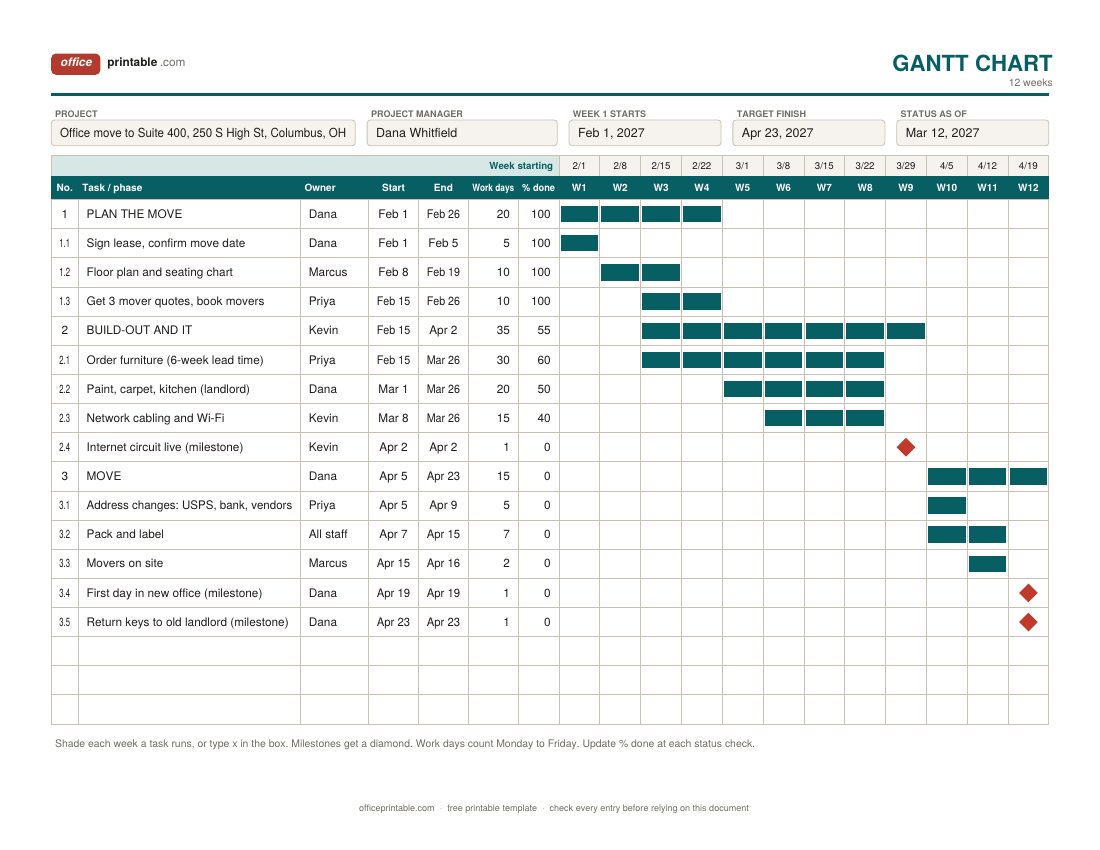
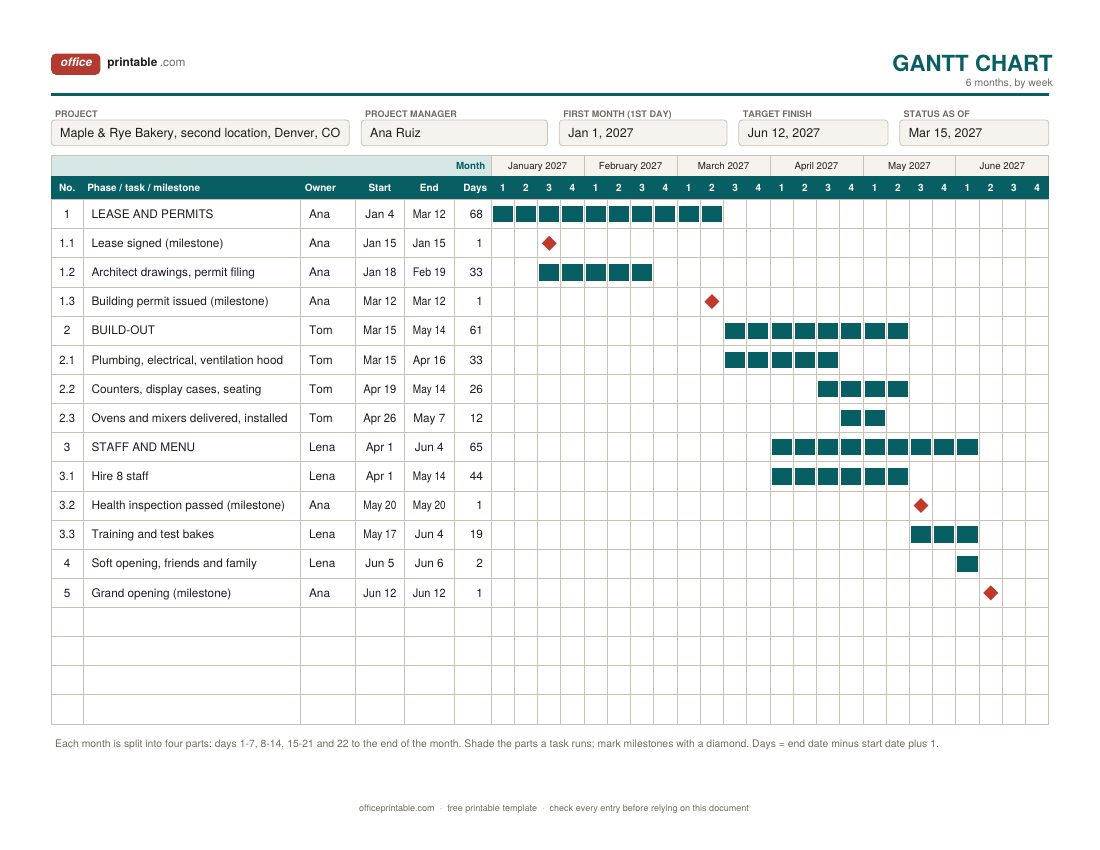
- Work days on the 12-week chart (Monday to Friday, counted with NETWORKDAYS in Excel). Calendar days on the 6-month and 30-day charts: end date minus start date plus 1.
- % done
- On the 12-week chart, how far along each task is on the status date.
- Depends on
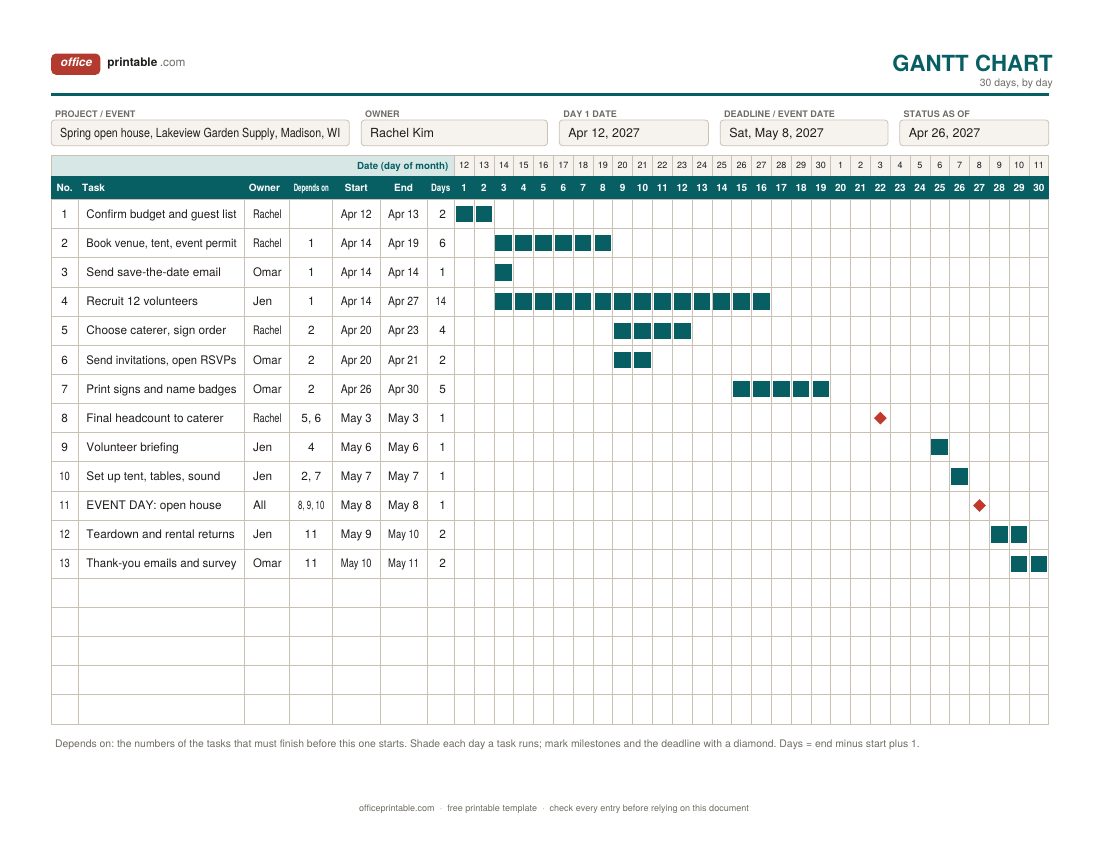
- On the 30-day chart, the numbers of the tasks that must finish before this one can start.
- Date row, bars and diamonds
- The row above the column headings holds the week starting dates, the month names or the calendar dates.
How to read a Gantt chart
Read it from left to right first. Each row is one piece of work, and the bar on that row starts in the week (or day) the work starts and stops in the week it ends. Bars that sit in the same columns are running at the same time which is fine until one person owns both. A diamond is a milestone: a point in time, like a signed lease or a launch, with no length of its own.
Then read it from top to bottom. Tasks are listed in the order they start, grouped under phases. When one bar starts right where another ends, there's usually a dependency between them. The last bar or diamond on the page is your finish date.
How to make a Gantt chart, step by step
Start with the list of work. On a bigger project, break it down first with a work breakdown structure so nothing gets missed, then copy the pieces onto the chart as phases and tasks. Keep one row per task of a day to a few weeks; smaller items belong on a project task tracker.
Next, estimate how long each task will take and note what it's waiting for. Put the fixed dates in first: a lease start, a trade show, an inspection that can only be booked on certain days. Then place every other task as early as its dependencies allow and give each one an owner. Add the milestones. Look for weeks where one person has three bars at once and move work until the load looks possible. Last, go through the chart with the team and the sponsor and write the date in the "status as of" box, so everyone knows which version they're looking at.
Using the Gantt chart Excel files
The Excel versions do the counting and draw the bars for you. Type the date of week 1, the first month or day 1 in the box at the top, and the date row above the columns fills in. For each task, type the start and end dates as real dates, for example 2/1/2027. The duration column works out the length: end minus start plus 1 for calendar days, or the NETWORKDAYS function for work days, which counts Monday to Friday. The bar cells use conditional formatting, so any week, part of a month or day that overlaps a task's dates turns teal. On the 12-week and 6-month charts, a task with the same start and end date shows in red as a milestone. Typing x in a bar cell shades it too.
The formulas and the shading also work when the file is opened in LibreOffice Calc. If you upload it to Google Sheets and the bars don't show, look under Format, then Conditional formatting, where a rule with a custom formula can be added. To add rows, insert them inside the table rather than below it, so the formulas and the shading rules stretch to cover them. Holidays aren't taken out of the work day count. To leave them out, list the holiday dates on the sheet and add that range as the third part of the NETWORKDAYS formula.
The PDF and Word versions don't shade themselves. Type an x in the boxes of the fillable PDF, use the table shading in Word, or print the chart and color the boxes with a highlighter. Plenty of teams pin a printed chart on the wall and redraw the bars in pencil each week.
Dependencies and the critical path, in plain words
A dependency is a task that has to wait for another one. You cannot set up desks before the carpet is down, and you cannot send invitations before the venue is booked. The most common kind is finish to start: task B starts when task A finishes. On the 30-day chart, the "depends on" column holds the numbers of the tasks a row is waiting for, so a quick look shows why a bar sits where it does.
Follow the chains of dependencies from the first task to the last and some chains turn out longer than others. The longest one is the critical path. A delay to any task on it pushes the finish date back by the same amount. Tasks off the critical path have some slack, also called float: they can slip a little without moving the end date. To find it by hand, start at the final milestone, look at the tasks it depends on, pick the one that finishes last, and keep working backward. Highlight those rows and check them every week.
Adding milestones to a Gantt chart
Milestones mark the moments that matter: a contract signed, a permit issued, a launch, a deadline someone else has set. They take no time of their own, so they show as a diamond rather than a bar. Add the ones your sponsor cares about, plus a checkpoint a week or two before each big one, while there's still time to act. If you report on milestones separately, list them with planned and actual dates on the project milestone tracker.
Which Gantt chart template to use
The 12-week chart suits most office and team projects: an office move, a website rebuild, a software rollout, a quarter of work. The 6-month chart is for longer projects such as opening a new location or a renovation, where weeks still matter but the whole plan has to fit on one page. The 30-day chart is a simple Gantt chart template for short, busy projects where a single day can make a difference, like an event, a product launch or a move-out. For a printable Gantt chart to hand out at a kickoff meeting, print the PDF on Letter or A4 paper.
Common Gantt chart mistakes
- Too much detail. A chart with 80 rows of half-day tasks never gets updated. Keep to the work people need to see.
- No owners. A bar with no name next to it belongs to nobody.
- Planning every task to start as late as possible. It looks efficient and leaves no room for anything to go wrong.
- Ignoring dependencies, so the chart shows two things happening at once that can't.
- Forgetting vacations, holidays and delivery lead times.
- Never updating it. Move the bars at each status check and keep the first version, so you can see later what slipped and why.
Gantt chart vs timeline vs kanban board
A Gantt chart shows tasks against dates, with durations, owners and dependencies. A timeline is simpler. It shows phases or events in order along a line, often for a wider audience, and the project timeline template has a 13-week project schedule, a 12-month view and a quarterly roadmap for that job. A kanban board hardly uses dates at all. It shows the state of each task (to do, doing, done) and suits a steady stream of work better than a project with a fixed end.
Many teams use two of them side by side: a Gantt chart for the plan and a kanban board for the work of the week. For the bigger plan the chart sits in, with scope, budget, roles and communication, use the project management plan template, and report progress against the chart with a project status report.
Questions
What is a Gantt chart?
A bar chart of a project schedule. Tasks are listed down the left side, time runs across the top, and each task is a bar from its start date to its end date. It's named after Henry Gantt, an American engineer who designed his chart around 1910 to 1915. A Polish engineer, Karol Adamiecki, had drawn a similar chart in 1896.
How do I make a Gantt chart in Excel?
List the tasks with their start and end dates, then shade the cells between the two dates in a row of week or day columns. The Excel files here already have the formulas and the conditional formatting, so you type the dates and the bars appear.
Can I make a Gantt chart in Word?
Word has no Gantt chart type of its own, but a table does the job. The Word version here is a ready-made table with a box for each week, part of a month or day. Shade the boxes with the table shading tool, or print the page and color them by hand.
Does the template work in Google Sheets?
Upload the Excel file to Google Drive and open it with Google Sheets. The duration formulas use functions Sheets supports, including NETWORKDAYS. If the bars do not shade after the upload, add a conditional formatting rule with a custom formula.
How many tasks should a Gantt chart have?
Few enough to read on one page. These charts hold 18 rows each. A large project reads better as a chart of its phases, with a separate chart for each phase.
What does a diamond on a Gantt chart mean?
It marks a milestone, an event with no duration such as an approval, a delivery or a launch date.
Comments and questions
Have a question about this template, or an idea to make it better? Leave a comment.
Leave a comment